Grouping in multiple dimensions with pivot_tables#
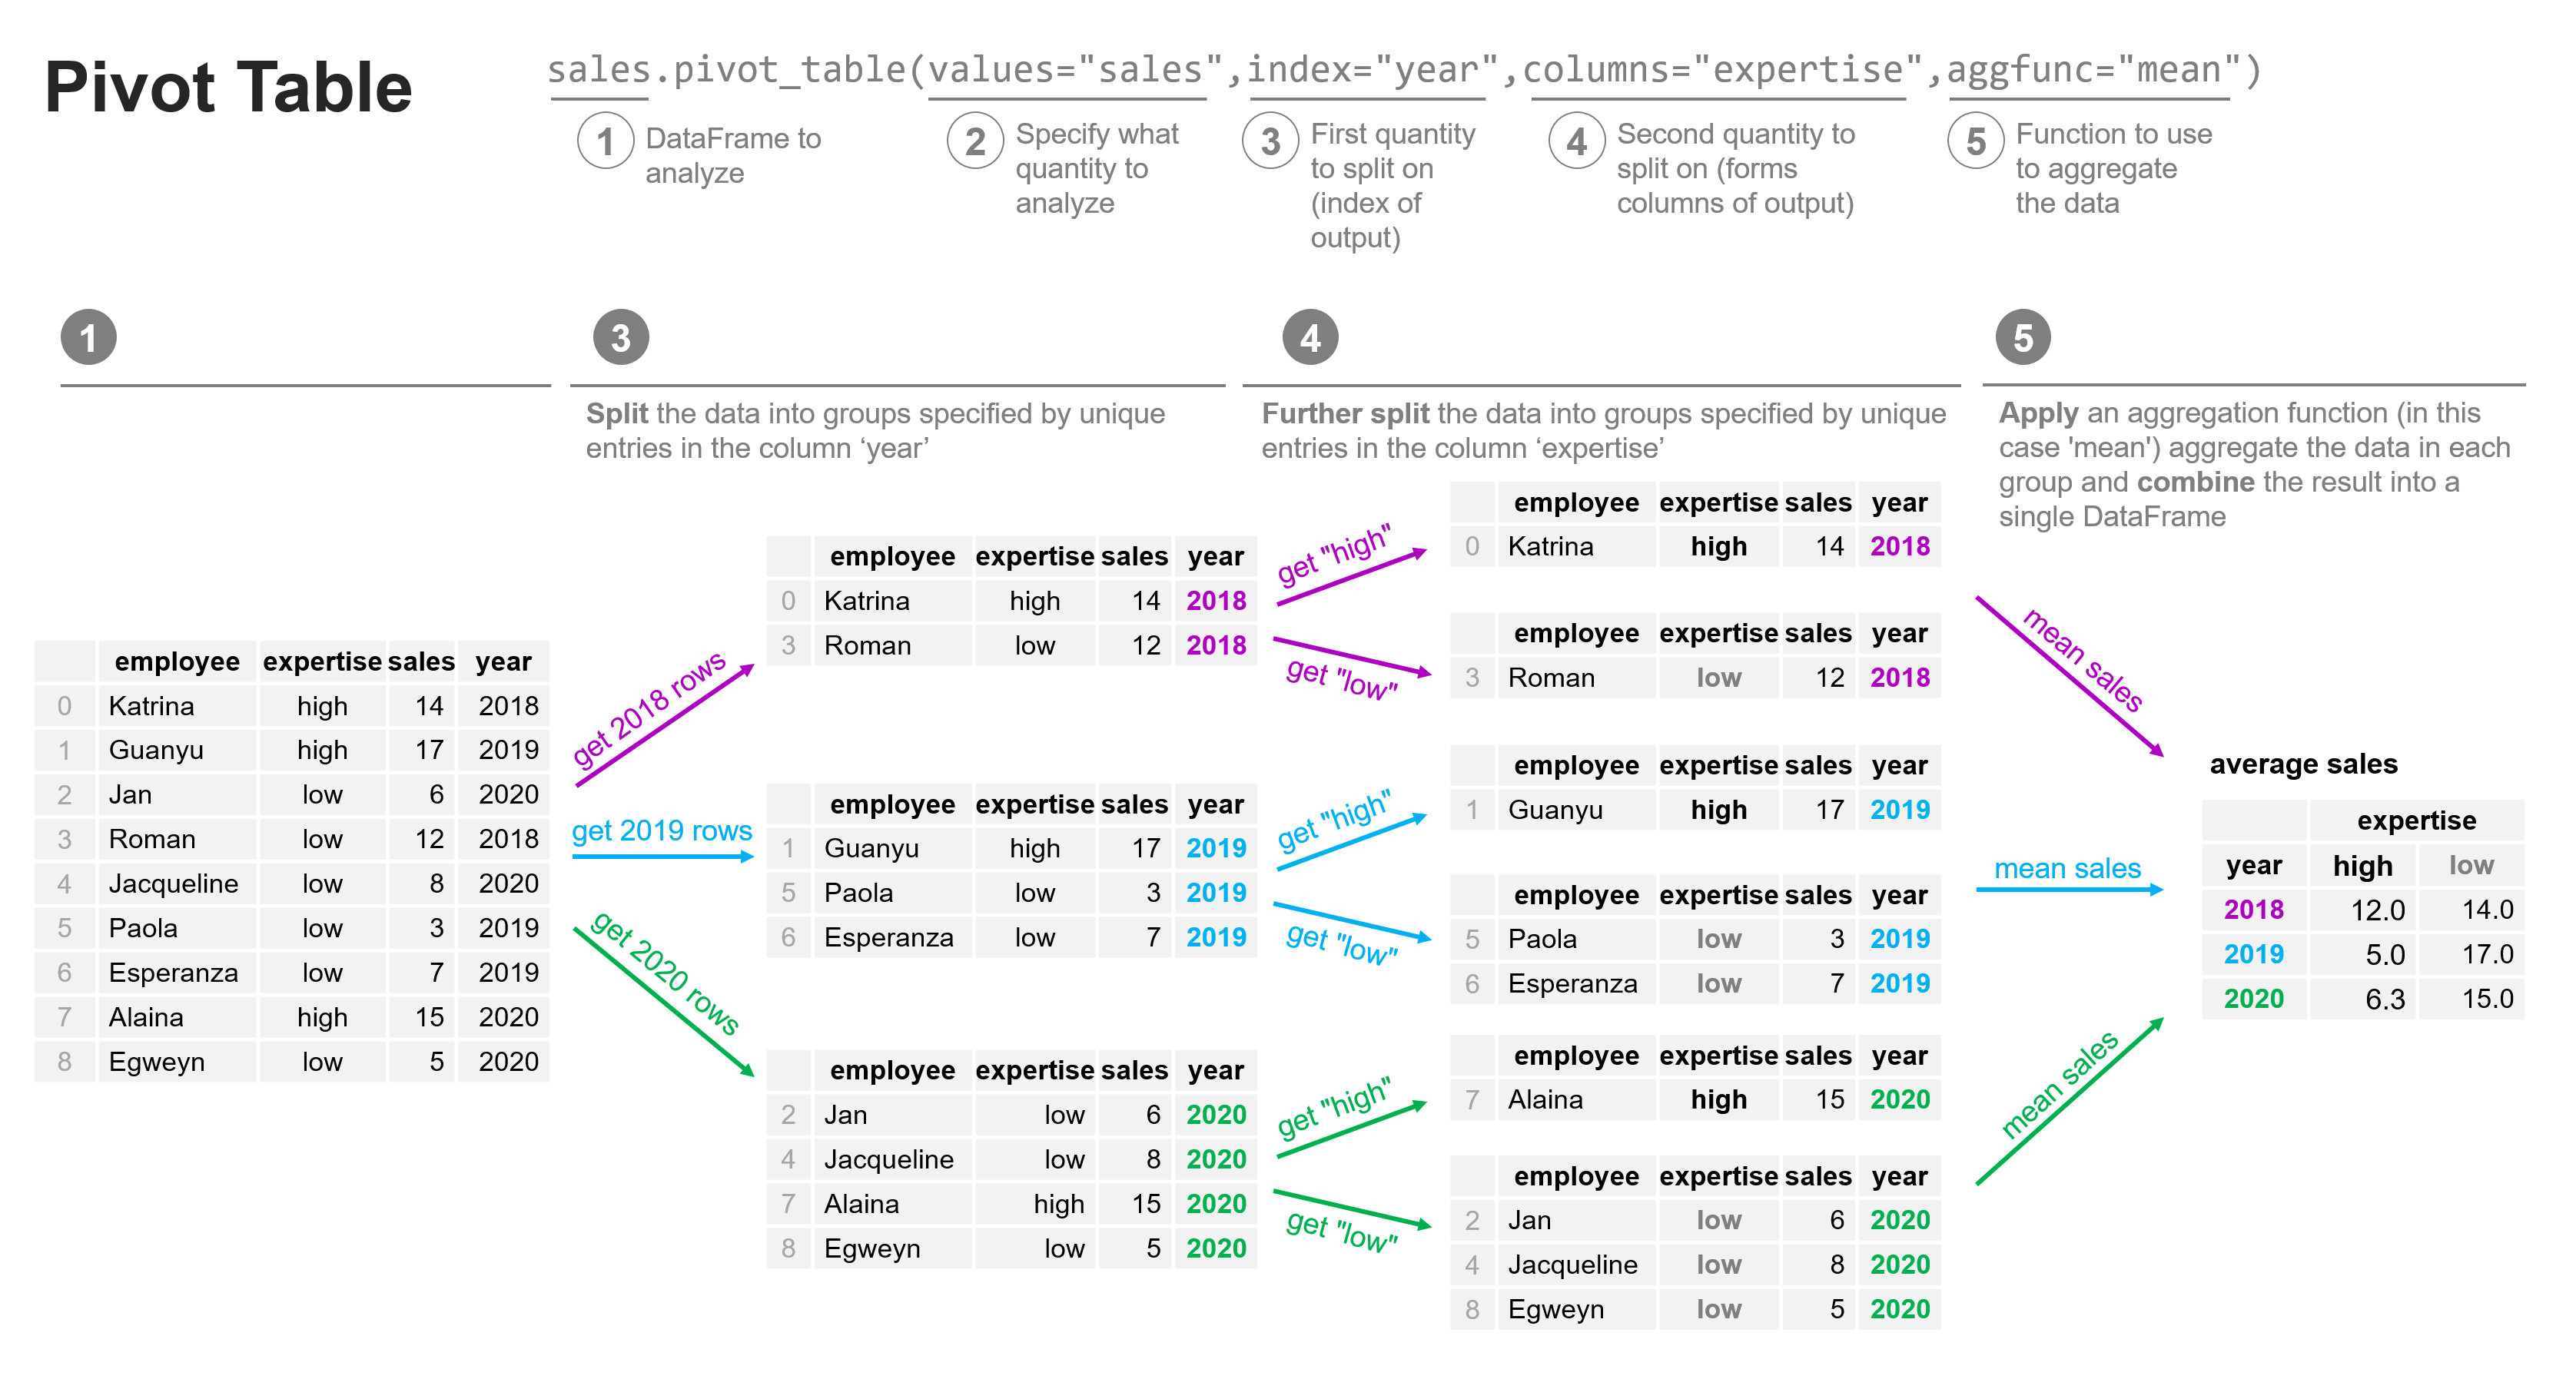
Using the groupby method, we were able to group data in the above examples according to year, and calculate some aggregate measure of the examples in each group. In our example, we calculated the total sales in each year. But what if we wanted to break it down further? Let’s consider if our sales data had an extra column, called ‘expertise’ as shown below. The new column represents the level of expertise of a sales representative as either “high” or “low” according to the judgement of their colleagues to see if sales were random or if their skill was correlated with their sales.
import pandas as pd

pd.set_option("mode.copy_on_write", True)

sales = pd.DataFrame(
    data={
        "employee": [
            "Katrina",
            "Guanyu",
            "Jan",
            "Roman",
            "Jacqueline",
            "Paola",
            "Esperanza",
            "Alaina",
            "Egweyn",
        ],
        "sales": [14, 17, 6, 12, 8, 3, 7, 15, 5],
        "expertise": ["high", "high", "low", "low", "low", "low", "low", "high", "low"],
        "year": [2018, 2019, 2020, 2018, 2020, 2019, 2019, 2020, 2020],
    }
)
sales
| employee | sales | expertise | year | |
|---|---|---|---|---|
| 0 | Katrina | 14 | high | 2018 |
| 1 | Guanyu | 17 | high | 2019 |
| 2 | Jan | 6 | low | 2020 |
| 3 | Roman | 12 | low | 2018 |
| 4 | Jacqueline | 8 | low | 2020 |
| 5 | Paola | 3 | low | 2019 |
| 6 | Esperanza | 7 | low | 2019 |
| 7 | Alaina | 15 | high | 2020 |
| 8 | Egweyn | 5 | low | 2020 |
This presents a new question: what were average sales per employee by year AND by the level of expertise. In this case, we don’t just want to know what the average sales were in 2018 across the employees, we want to know what the average sales in 2018 were for the “high” expertise employees and the “low” expertise employees, respectively. To accomplish this, we can use pivot_tables, as shown in the figure below:
Now lets try that for ourselves:
avg_sales = sales.pivot_table(
    values="sales", index="year", columns="expertise", aggfunc="mean"
)
avg_sales
| expertise | high | low |
|---|---|---|
| year | ||
| 2018 | 14.0 | 12.000000 |
| 2019 | 17.0 | 5.000000 |
| 2020 | 15.0 | 6.333333 |
Summary#
Grouping data along either one characteristic (groupby) or two (or more) characteristics (pivot_table) can allow us to quickly aggregate our data into the format we need to be able to answer key data science questions. Understanding how to use these tools programmatically is a significant advantage for data preparation and analysis. We’ve talked quite a bit about preparing data up to this point. In the next lesson, you’ll explore how to query your data quickly and efficiently.