Mapping with Geopandas#
Mapping is a GIS specialization unto itself, but in this reading I want to provide a really quick intro to some of the tools available for mapping data with geopandas.
plot()#
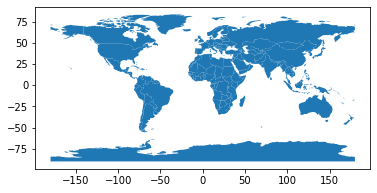
As we saw in our previous readings, the .plot() command is an easy way to create maps in geopandas. Just running .plot() will result in geopandas visualizing our data:
import geopandas as gpd

# Load GIS data
world = gpd.read_file(gpd.datasets.get_path("naturalearth_lowres"))

# Plot!
world.plot()
<AxesSubplot:>
Moreover, as we saw in our intro reading, if you pass .plot() a column name, geopandas will color each observation based on the value of that variable to create something called a choropleth map:
world["gdp_per_cap"] = world["gdp_md_est"] / world["pop_est"]
world = world[world["name"] != "Antarctica"].copy()
world.plot("gdp_per_cap", cmap="Reds")
<AxesSubplot:>
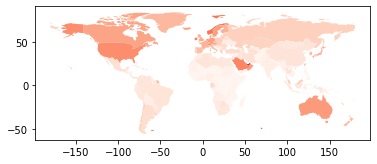
(Note the geopandas .plot() method also accepts all the usual arguments you might pass to matplotlib, like cmap, which controls the colors used in the plot).
And that’s the basics of plotting! If you’d like to know more about the .plot() function, you can read more about it here.
Mapping with Altair#
You aren’t limited to the .plot() method (and matplotlib syntax) for plotting though – you can also make Altair maps with the alt.utils.sanitize_dataframe() method:
import altair as alt

world = alt.utils.sanitize_dataframe(world)

alt.Chart(world[world["name"] != "Antarctica"]).mark_geoshape().encode(
    color="pop_est", tooltip=["name", "pop_est"]
)
Note that altair does not, natively, respect the CRS of the passed geodataframe, but it does have a project() method for re-projecting. You can find a full list of supported projections here. Pictures of all projects available a little down from this link.
alt.Chart(world[world["name"] != "Antarctica"]).mark_geoshape().project(
    "equalEarth"
).encode(color="pop_est", tooltip=["name", "pop_est"])
Native Interactive Maps#
But perhaps the coolest mapping trick that is provided by geopandas is the ability to create interactive maps just using the .explore() method!
world.explore()
Which can also be combined with lots of options:
world.explore(
    column="pop_est",
    scheme="naturalbreaks",  # use mapclassify's natural breaks scheme
    legend=False,  # show legend
    k=10,  # use 10 bins
    name="countries",  # name of the layer in the map
    cmap="Reds"
)
To learn more, you can read the full docs here! and/or try it yourself!